
ECharts GL
3D 图表、地理可视化、WebGL 加速渲染
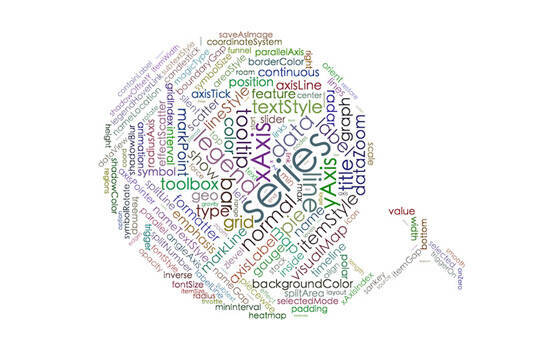
字符云
字符云可以将文字根据不同的权重布局为大小、颜色各异的图,支持使用图片作为遮罩。
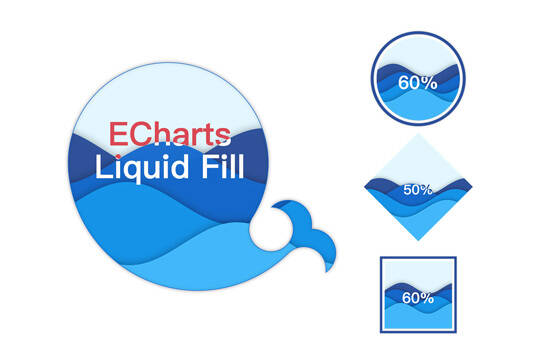
水球图
水球图是一种适合于展现单个百分比数据的图表,支持多条水波和动画。

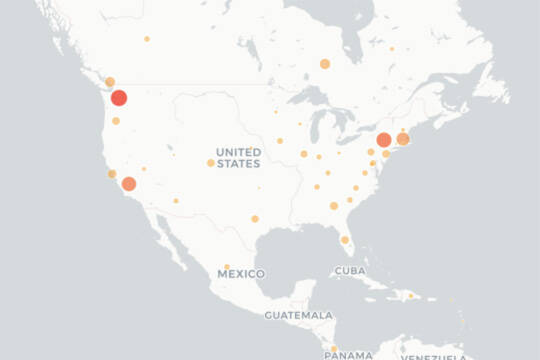
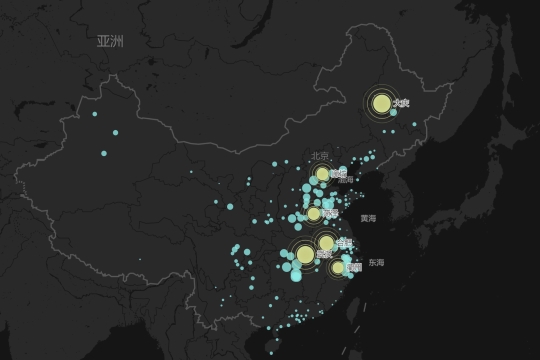
百度地图
百度地图扩展,可以在百度地图上展现点图、线图、热力图及饼图等。
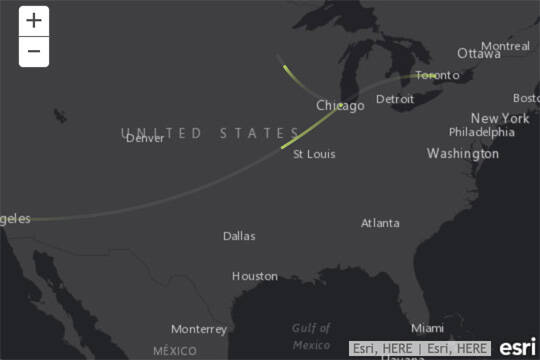
ArcGIS 地图
ArcGIS 地图和 ECharts 3 的结合。
echarts-leaflet
ECharts extension for visualizing data on leaftlet.

Mapbox 地图
Mapbox 地图和 ECharts 的结合。
高德地图
高德地图扩展,可以在高德地图上展现点图、线图、热力图及饼图等。

angular-echarts
AngularJs bindings for ECharts.
echarts-ng
使用 Angular 封装 ECharts 为指令。
ng-echarts
AngularJs 版 ECharts,支持 ECharts 3。
vue-echarts
Apache ECharts 的 Vue.js 组件。
vue-echarts
A custom directive for using ECharts in Vue.js apps.
echarts-middleware
在 Vue 中优雅高效地使用 ECharts。
echarts-for-react
一个简单的 Apache ECharts 的 React 封装。
react-echarts
ECharts + React.
re-echarts
ECharts + React.
pyecharts
Python ECharts Plotting Library.
echarts-python
Generate ECharts options with Python.
krisk
Krisk brings ECharts to Python, and helpful tools for statistical interactive visualization.
Rails Charts
Rails Charts提供了一个Ruby gem,可以在Ruby on Rails应用程序中使用图表。

echarty
echarty 提供了 ECharts 的 R 语言接口。
recharts
recharts 提供了 ECharts 的 R 语言接口。
recharts
An R Interface to ECharts.
ECharts2Shiny
To insert interactive charts from ECharts into R Shiny applications.
ECharts.jl
Julia package for the ECharts 3 visualization library.
purescript-echarts
Purescript bindings for ECharts library.
iOS-Echarts
This is a highly custom chart control for iOS and Mac apps, which builds with ECharts 2.
ECharts-Java
这是一个针对 ECharts 2 的 Java 类库,实现了所有 ECharts 中的 JSON 结构对应的 Java 对象。
EChartsSDK
ECharts 的 .NET 类库,从 ECharts 的 Java 类库移植。
Echarts-PHP
A PHP library that works as a wrapper for ECharts.
flutter_echarts
A Flutter widget to use ECharts in a reactive way.
